Colorimetric Response of pH Indicator Dye Solutions and Labels to Ammonia Gas Exposure for Smart Packaging Applications
DOI:
https://doi.org/10.22437/ifstj.v9i2.47837Keywords:
Indicator dye, ammonia gas, ∆E, pH, smart labelAbstract
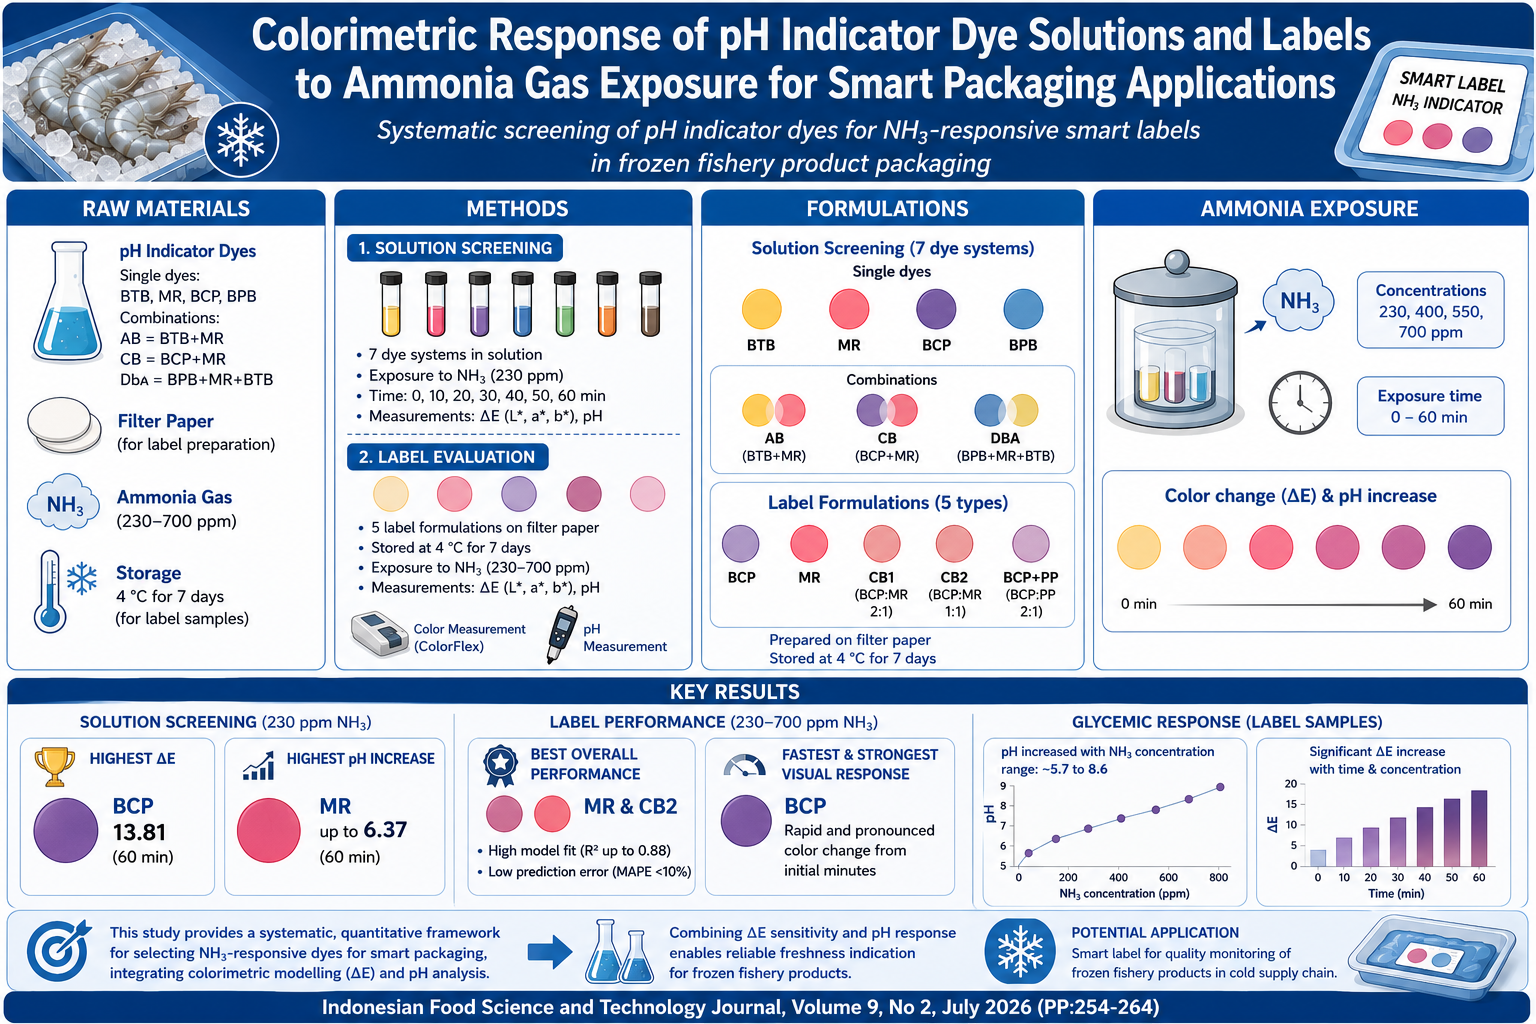
Frozen fishery products in the cold supply chain require fast, accurate, and real-time quality monitoring systems. Ammonia gas (NH3) generated from protein degradation is a key spoilage indicator in these products. This study evaluates the colorimetric sensitivity of pH indicator dye solutions and colour labels upon exposure to ammonia gas (230–700 ppm) as part of efforts to develop colour-changing smart labels for food quality monitoring. Seven dye systems were screened as solutions: single dyes (BTB, MR, BCP, BPB) and combinations (AB = BTB+MR; CB = BCP+MR; DBA = BPB+MR+BTB). Based on screening results, five label formulations (BCP, MR, CB1 = BCP:MR 2:1, CB2 = BCP:MR 1:1, and BCP+PP = BCP:Phenolphthalein 2:1) were subsequently prepared on filter paper and evaluated. Parameters observed included total colour change (∆E), individual colour coordinates (L*, a*, b*), and pH change over 60 minutes. Results showed that BCP solution had the highest ∆E value (13.81), while MR solution exhibited the greatest pH increase (up to 6.37). For label applications, MR and CB2 provided the best overall performance, combining ∆E stability (R2 up to 0.88, MAPE <10%) with appropriate pH responsiveness. The BCP label showed the most rapid and pronounced visual colour change from the initial minutes of exposure. These findings demonstrate that the combination of ∆E sensitivity and pH response constitutes a crucial basis for selecting dyes for ammonia indicator labels in smart packaging systems. This study contributes a systematic, quantitative screening framework for dye selection, integrating colorimetric modelling and pH analysis for the development of NH3-responsive smart labels.
References
[1] R. Montanari, “Cold chain tracking: a managerial perspective,” Trends Food Sci. Technol., vol. 19, no. 8, pp. 425–431, 2008, doi: 10.1016/j.tifs.2008.03.009.
[2] M. Thirupathi Vasuki, V. Kadirvel, and G. Pejavara Narayana, “Smart packaging—An overview of concepts and applications in various food industries,” Food Bioeng., vol. 2, no. 1, pp. 25–41, 2023, doi: 10.1002/fbe2.12038.
[3] D. Y. Kim, S. W. Park, and H. S. Shin, “Fish Freshness Indicator for Sensing Fish Quality during Storage,” Foods, vol. 12, no. 9, 2023, doi: 10.3390/foods12091801.
[4] Y. W. Hasnedi, “Pengembangan kemasan cerdas (smart packaging) dengan sensor berbahan dasar chitosan-asetat, polivinil alkohol, dan pewarna indikator bromothymol blue sebagai pendeteksi kebusukan fillet ikan nila,” Institut Pertanian Bogor, 2009.
[5] E. Warsiki and Riris Octaviasari, “Identification of media and indicator liquid as a recorder smart label,” in International Conference on Adaptive and Intelligent Agroindustry (ICAIA), 2015, pp. 169–173. doi: 978-1-4673-7404-0.
[6] E. S. Thamrin, E. Warsiki, and T. Djatna, “Model asosiasi perubahan warna pada indikator kemasan cerdas dan perubahan mutu produk susu,” J. Teknol. Ind. Pertan., vol. 27, no. 1, pp. 96–102, 2017, doi: 10.24961/j.tek.ind.pert.2017.27.1.96.
[7] X. Luo, A. Zaitoon, and L. T. Lim, “A review on colorimetric indicators for monitoring product freshness in intelligent food packaging: Indicator dyes, preparation methods, and applications,” Compr. Rev. Food Sci. Food Saf., vol. 21, no. 3, pp. 2489–2519, 2022, doi: 10.1111/1541-4337.12942.
[8] N. Shukla, A. K. Tripathi, A. Tiwari, S. Pophaly, K. Sharma, and S. Sahu, “From Farm to Table: Advancements in Smart Packaging for Dairy and Food Products,” Biol. Forum-An Int. J., vol. 16, no. 4, p. 33, 2024.
[9] A. R. Bhatlawande, P. U. Ghatge, G. U. Shinde, and R. K. A. Sagar, “Unlocking the future of smart food packaging : biosensors , IoT , and nano materials,” Food Sci. Biotechnol., vol. 33, no. 5, pp. 1075–1091, 2024, doi: 10.1007/s10068-023-01486-9.
[10]T. Mkhari, J. O. Adeyemi, and O. A. Fawole, “Recent Advances in the Fabrication of Intelligent Packaging for Food Preservation: A Review,” Processes, vol. 13, no. 2, pp. 1–49, 2025, doi: 10.3390/pr13020539.
[11] P. H. N. Crosby and A. N. Netravali, “Green Thermochromic Materials : A Brief Review,” Adv. Sustain. Syst., vol. 2200208, pp. 1–12, 2022, doi: 10.1002/adsu.202200208.
[12] A. Hakami, S. S. Srinivasan, P. K. Biswas, A. Krishnegowda, and S. L. Wallen, “Review on thermochromic materials : development , characterization , and applications Graphical abstract Enhanced energy efficiency of buildings with smart coatings of microencapsulat, Review on thermochromic materials : development , characterization ,” J. Coatings Technol. Res., vol. 19, no. 2, pp. 377–402, 2022, doi: 10.1007/s11998-021-00558-x.
[13] U. Altaf, V. Kanojia, and A. Rouf, “Novel packaging technology for food industry,” J. Pharmacogn. Phytochem., vol. 7, no. 1, pp. 1618–1625, 2018, [Online]. Available: http://www.phytojournal.com/archives/2018/vol7issue1/PartV/7-1-328-377.pdf
[14] E. S. Thamrin, K. I. 2022. K. B. P. T. T. L. D. S. P. P. P. I. J. I. dan T. P. 11(4):635–643. Warsiki, EndangThamrin ES, Warsiki E, Bindar Y, Y. Bindar, and I. A. Kartika, “Karakterisasi Bahan Pewarna Tinta Termokromik Leuco Dye System Pada Produk Pempek Ikan,” J. Ilmu dan Teknol. Pangan, vol. 11, no. 4, pp. 635–643, 2022.
[15] R. Riyanto, I. Hermana, and S. Wibowo, “Karakteristik Plastik Indikator sebagai Tanda Peringatan Dini Tingkat Kesegaran Ikan dalam Kemasan Plastik,” J. Pascapanen dan Bioteknol. Kelaut. dan Perikan., vol. 9, no. 2, p. 153, 2014, doi: 10.15578/jpbkp.v9i2.108.
Downloads
Published
Issue
Section
License
Copyright (c) 2026 Indonesian Food Science and Technology Journal

This work is licensed under a Creative Commons Attribution 4.0 International License.